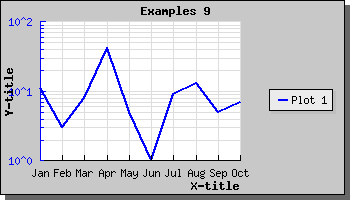
Figure 22: Specifying text labels for the X-axis [src]
You might want to have specific labels you want to use for the X-axis when this has been specified as a "text" scale. In the previous example each Y-point might represent a specific measurement for each of the first 10 month. We might then want to display the name of the months as X-scale.
To specify the labels on the scale you make use of the SetTickLabels() method.
To get a localized version of the name of the month you can use a nice feature in JpGraph, the global '$gDateLocal' object which is an instance of the DateLocale
This class has a number of methods to get localized versions of relevant names for dates, (months and weekdays).
So to specify the X-axis with the short form of the month names we use the construction
  $a =
$gDateLocale->
GetShortMonth();

$graph->xaxis->
SetTickLabels(
$a);
This will, now result in the image displayed below